How USDA Linked Federal and Commercial Data to Shed Light on the Nutritional Value of Retail Food Sales
Overview
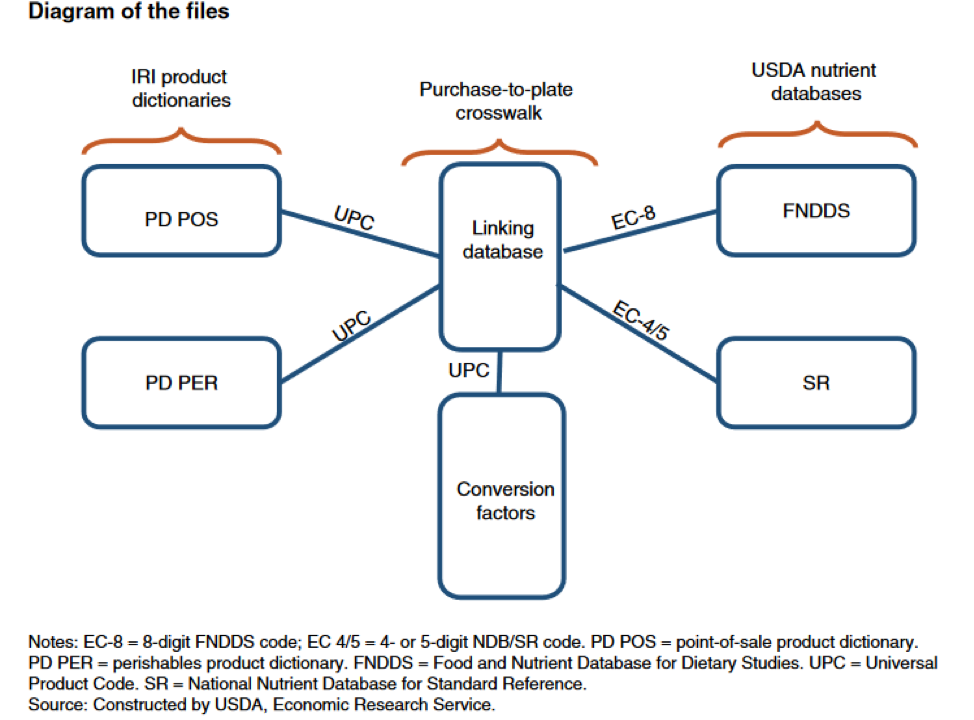
Purchase-to-Plate Crosswalk (PPC) links the more than 359,000 food products in a comercial company database to several thousand foods in a series of USDA nutrition databases. By linking existing data resources, USDA was able to enrich and expand the analysis capabilities of both datasets. Since there were no common identifiers between the two data structures, the team used probabilistic and semantic methods to reduce the manual effort required to link the data.
Source
Details
Originally published September 6, 2019
Americans spend about half of their food budgets to purchase about two-thirds of their food from stores. The U.S. Department of Agriculture (USDA) buys proprietary household and retail scanner data to conduct research on consumer behavior, food prices, available new products, and to understand how healthy consumer food choices are. These data can be used to analyze sales in dollar amounts or quantities purchased, but cannot provide a full picture of the nutritional quality. Although the data contains the Nutrition Facts label information listed on some packaged foods, there is no information on nutrients or the nutritional profile of unpackaged food, like produce. In addition, the data do not allow for a more detailed analysis, such as determining the amount of vegetables in frozen pizzas or the amount of beef in meatballs.
USDA’s Economic Research Service (ERS) Food and Nutrition Service – Center for Nutrition Policy and Promotion (FNS-CNPP) and Agricultural Research Service (ARS) recently created the Purchase-to-Plate Crosswalk (PPC), which expands the use of the commercial data for research on American food choices. This crosswalk links the more than 359,000 food products in a commercial company database to several thousand foods in a series of USDA nutrition databases. Since there is no common identifiers between the two data structures, the team used probabilistic and semantic methods to reduce the manual effort required to link the data.
Lessons for other agencies
By linking existing data resources, USDA was able to enrich and expand the analysis capabilities of both datasets. Other agencies can learn from the USDA’s approach to linking data to gain new insights from already available data. Working with both internal and external stakeholders, USDA identified clear project goals, linking criteria, and evaluation methods. The team sought a contractor with expertise in automated data matching strategies. In addition, an independent team of data scientists is conducting a data audit which involves a review of the methods as well as discussions with current and potential stake holders on future uses and usability of the data.
The Problem
Without these linked data, policy makers and researchers have been limited in their ability to address some important questions. For example, for over a decade, ERS has purchased and analyzed proprietary data on household food purchases and retail food sales from IRI, a market research company, but these data offer limited information about the nutritional value of the purchases. To better understand how buyers’ food choices compare to the recommendations in the Dietary Guidelines for Americans, the proprietary data needed to be linked to USDA nutrition databases. The USDA databases quantify amounts of nutrients (beyond the Nutrition Facts label) and the number of servings of major food groups contained in about 15,000 food items. In addition, linking the datasets will allow USDA to estimate food prices for the next update of the market basket for the Thrifty Food Plan, the basis of the annual update for the maximum allotment for the Supplemental Nutrition Assistance Program (SNAP) benefits.
Challenges to Linking Data
Any matching problem requires a set of match criteria to define which matches are acceptable. This project had two criteria: nutrition and price. That is, the linking database is used both to integrate nutrition data into the scanner data and to provide price estimates for foods in the USDA Food Plans. This dual match criteria added to the complexity of the matching problem, and led to more unmatched Universal Product Code (UPCs) than if the team had simply chosen one.
Once the match criteria were chosen, the team faced additional challenges from differences between The IRI and USDA databases:
- Original goals: the USDA nutrition databases were developed to allow researchers and policymakers to monitor the diet quality of Americans. Researchers measure diet quality by comparing the nutrient or food group quantities to the recommended amounts. IRI compiled its data for market research.
- Form of the food: IRI food items are in the form that is available for purchase, while USDA data is typically in the edible form. For ready-to-eat or ready-to-heat foods such as frozen pizza, bread, and ready-cut vegetables, the retail and edible forms are the same. But USDA items also include foods that require preparation or combinations of retail foods.
- *Level of detail of food items: *The IRI scanner data provide a very granular picture of the foods Americans purchase from stores. The 350,0000 annually reported food items are at the product barcode or UPC level, which differentiate foods based on brand, flavor, package size and type, and in some cases where the product is sold. The 15,000 USDA data foods are more general.
- *Text descriptions: *Both databases use different words or strings of words to mean the same thing. For example, “fresh” in the IRI data may describe a produce item, while the USDA data would use “raw.” The USDA data tends to begin text descriptions with major foods such as “broccoli,” “beef,” or “pepper, red,” while the IRI text descriptions typically begin with a brand name, put the words in the order we say them, and often includes include package sizes (e.g. “Fresh Farm Red Pepper, 3 pack”). The IRI data also has more data columns with product description information.

Probabilistic and Semantic Matching
The team created the linking database using a combination of auto¬mated and manual matches, with intermediate review by nutritionists. The final result was 650,592 UPCs matched to 4,390 Food and Nutrient Database for Dietary Studies (Food and Nutrient Database for Dietary Studies (FNDDS)) and National Nutrient Database for Standard Reference (SR) with a 5-percent error rate for each linking category.
The team used semantic matching to identify possible sub-text string matches between the federal and commercial data. Semantic matching searches full-text strings in one list for words and phrases in the other list that are either identical or mean similar things.
Both automated semantic matching methods and human review developed the search table that paired IRI food description terms with USDA food description terms having the same meaning. Automated methods developed draft mapping rules, and then nutritionists reviewed all rules and augmented the search table by identifying phrases in the IRI text descriptions that match to FNDDS descriptions.
In probabilistic matching, a program used the search table to compare the attributes in each UPC text description and other information in the IRI data to FNDDS text descriptors. The similarity of the two food descriptions across a number of different attributes determined a similarity score for each possible match. Matches between attribute values (or synonyms) from the search table added to the total similarity score, while nonmatches subtracted from the score. The program selected IRI-FNDDS food item pairs with the highest score.
To use the power of the semantic and probabilistic matching, the data had to be prepared. Researchers prioritized which UPCs and USDA food codes were included, created complete text descriptions, and divided the UPCs and USDA food codes into linking categories to streamline the matching process. For some linking categories, the team parsed the USDA text descriptions into columns more similar to the IRI data. In other cases, it was more efficient to combine IRI fields into a single text string.
New Insights: Americans’ Store Food Purchases Are Not That Healthy

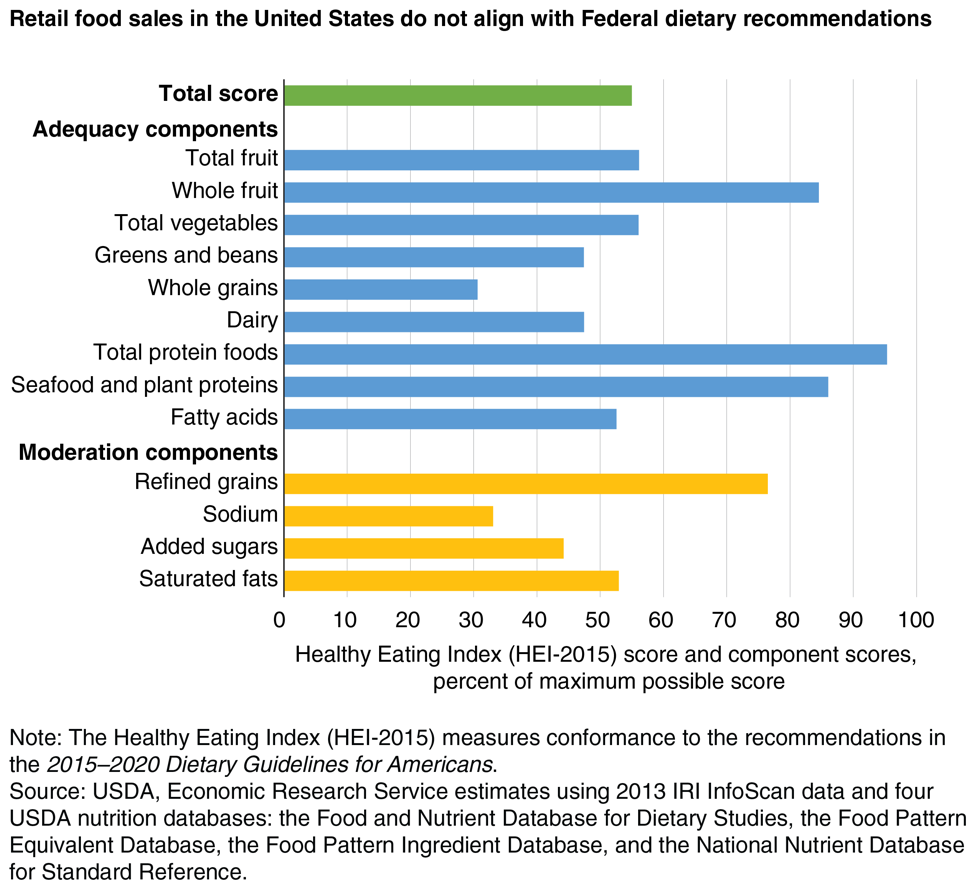
ERS researchers scored nutritional quality using the Healthy Eating Index (HEI) developed by the National Cancer Institute and FNS-CNPP. This index summarizes how well a set of foods conforms to the recommendations in the Dietary Guidelines for Americans. The highest possible score is 100, indicating conformance to Federal recommendations for 13 dietary components.
For the nine adequacy components that make up a healthy diet, a high score indicates Americans are purchasing sufficient amount of foods in these food groups. A high score among the four components that nutritionists advise to consume in moderation indicates Americans are keeping purchases of foods containing these components in check.
The PPC showed that retail food sales in 2013 scored 55 out of 100. Among the adequacy components, scores were highest for total protein, seafood and plant proteins, and whole fruit (85 percent). On the other hand, scores for whole grains, greens and beans, and dairy components were each below 50 percent. For the moderation components (refined grains, sodium, added sugars, and saturated fats), the scores indicate overall U.S. food sales are not well aligned with key recommendations in the Dietary Guidelines, particularly with regard to sodium and added sugars.
By linking datasets for this project, USDA provided a new way to examine American food purchases and how they measure up, offering additional insights and evidence for assessing food and nutrition choices.
Postscript
To learn more, read the technical bulletin: “Linking USDA Nutrition Databases to IRI Household-Based and Store-Based Scanner Data” or contact Andrea Carlson at andrea.carlson@usda.govor Elina Page at elina.t.page@usda.gov.
The Federal Data Strategy Incubator Project
The Incubator Project helps federal data practitioners think through how to improve government services, enabling the public to get the most out of federal data. This Proof Point and others will highlight the many successes and challenges data innovators face every day, revealing valuable lessons learned to share with data practitioners throughout government.
Guidance references
- FDS Practice 01 Identify Data Needs to Answer Key Agency Questions
- FDS Practice 04 Use Data to Guide Decision-Making
- FDS Practice 06 Convey Insights from Data
- FDS Practice 17 Recognize the Value of Data Assets
- FDS Practice 22 Identify Opportunities to Overcome Resource Obstacles
- FDS Principle 03 Promote Transparency
- FDS Principle 05 Harness Existing Data
- FDS Principle 08 Invest in Learning

